Quick Answer: Data centre power density is the electrical load each rack draws, measured in kilowatts (kW). Uptime Institute's 2026 survey puts the average of operators' most common rack densities at 11 kW, up from 9 kW in 2025. AI systems sit far above that, with NVIDIA's GB200 NVL72 rated at about 120 kW per rack and next-generation racks listed at up to 240 kW. Above roughly 20 to 25 kW per rack, liquid cooling usually becomes the more economical choice.
Key Takeaways
- Data centre power density measures electrical load per rack, with Uptime Institute reporting operators’ average modal density rising from 9 kW in 2025 to 11 kW in 2026.
- Rated, provisioned, and measured power are different figures; provisioned capacity determines what hardware can run, while measured draw drives actual operating costs.
- Most enterprise racks remain below 20 kW, while AI training systems can exceed 100 kW, including NVIDIA GB200 NVL72 racks at about 120 kW.
- Liquid cooling generally becomes more economical above roughly 20–25 kW per rack and increasingly necessary as density rises toward rack-scale AI levels.
- Real rack capacity is limited by circuit derating, A+B redundancy, breaker sizing, cooling design, and whether facilities can deliver guaranteed kilowatts with redundancy intact.
- Buyers should plan density by workload and ask providers about deliverable kW, cooling basis, billing, upgrade paths, backup power, and liquid-cooling readiness.
- Book a facility tour and bring your rack plan to verify Qu Data Centres’ deliverable power, cooling capacity, and upgrade path before committing.
Rack density is one of the most quoted and least defined numbers in infrastructure planning. One report says the typical rack draws under 10 kW, another says AI racks pull more than 100 kW, and both are correct. If you are signing off on a hardware refresh or a GPU deployment, that gap is not academic.
Overestimate density and you pay for power and cooling that sit idle every month. Underestimate it and the new hardware arrives to find circuits, breakers, or cooling that cannot support it. Either mistake is expensive, and neither shows up until the contract is signed.
What Is Data Centre Power Density and How Is kW Per Rack Measured?
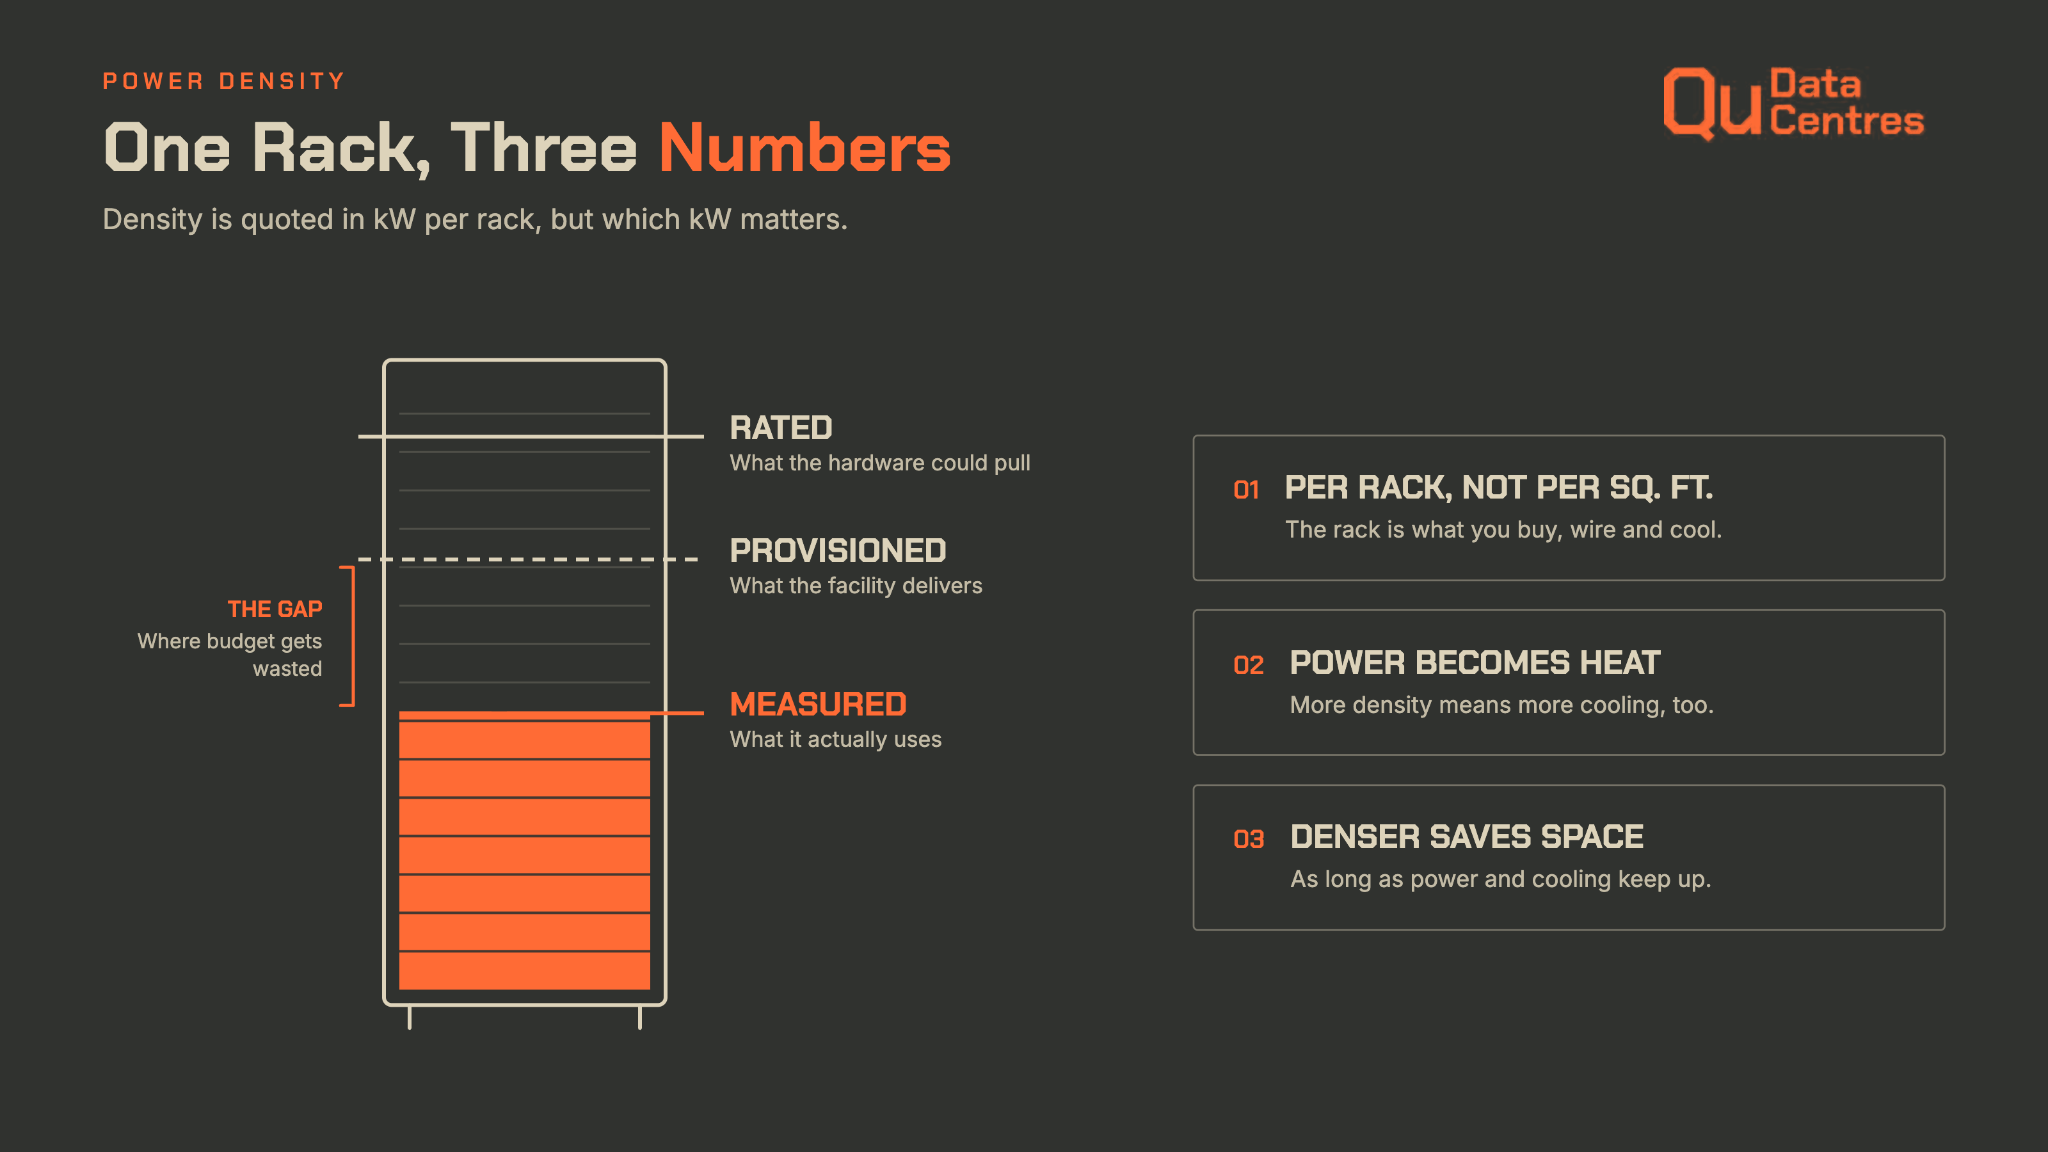
Data centre power density describes how much electrical load sits inside a given footprint, and today it is almost always quoted per rack. The figure drives decisions about circuits, cooling, and contract size. Three different numbers hide behind it, and mixing them up is the most common source of confusion.
Facilities were once sized in watts per square foot, a floor-level figure that said little about what any one customer could install. Kilowatts per rack replaced it because the rack is the unit a customer buys, wires, and cools. A 6 kW rack and a 30 kW rack can sit on the same square foot of raised floor and place completely different demands on the building. That is why kW per rack decides what you can install in a colocation cabinet before the facility's limits are reached.
Rated, Provisioned, and Measured Power Draw
Quoted densities usually refer to one of three numbers, and they rarely match. Keeping them apart makes any survey or vendor claim easier to read.
- Rated Draw: The maximum the hardware can pull, taken from nameplate or thermal design power. NVIDIA lists about 120 kW for a GB200 NVL72 rack, for example.
- Provisioned Power: What the facility reserves and can deliver to the cabinet after circuit limits and redundancy are applied.
- Measured Draw: What the racks pull in normal operation, which is often well below rated draw.
Provisioned power decides whether hardware can be switched on, and measured draw decides what you should be paying for. The gap between the two is where most budget gets wasted, as the colocation section below shows.
How Rack Density Affects Cooling, Cost, and Floor Space
The reason data centres need so much power is simple. Almost every watt delivered to a server leaves as heat, so every kilowatt of IT load needs matching cooling capacity.
That is why data centre power and cooling are planned together, and why a density increase hits both budgets at once. Each density tier also calls for a different data centre cooling approach.
Density does buy something in return. Fewer, fuller racks cut floor space and cabling, and Uptime notes that it does not take many servers to cross 10 kW when mainstream models approach or exceed 1 kW each. The catch is that density only pays off when the power and cooling serving each rack can keep up.
Data Centre Power Density Trends: How Average kW Per Rack Has Changed
Average rack density is rising, but more slowly than headlines suggest, and the pace depends on who is counting. The latest Uptime Institute surveys give the cleanest read on the installed base, and they show why a single average hides two very different markets.
Average Vs Modal Rack Density in the 2026 Surveys
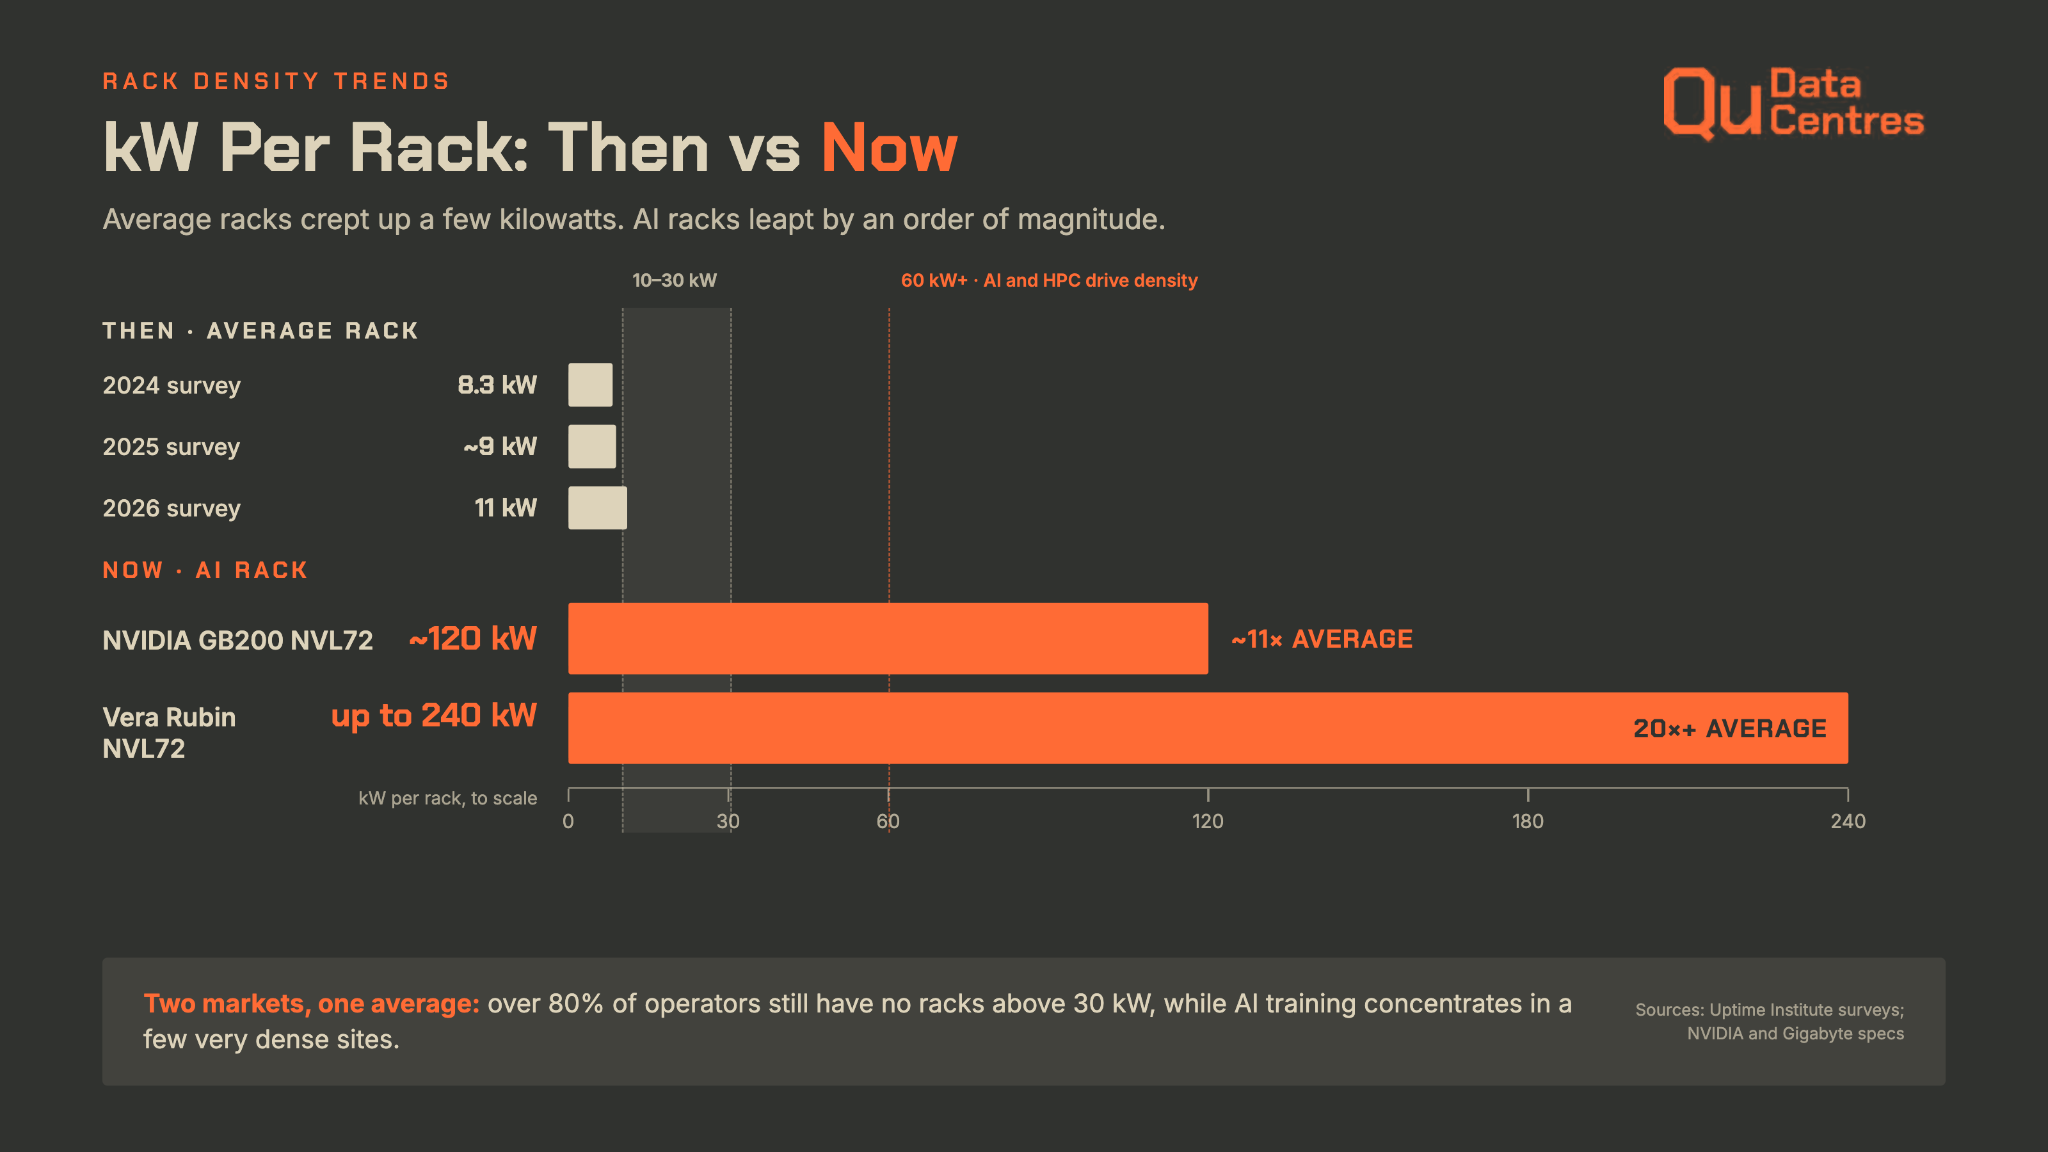
Uptime asks each operator for the most common (modal) rack density in its facility, then averages those answers across the sample. In 2026 that average reached 11 kW, up from 9 kW in 2025. Excluding facilities designed for typical densities above 30 kW, it sits at 7.8 kW, up from 7.5 kW a year earlier.
The 2025 report shows the same pattern, with the average at almost 9 kW, up from 8.3 kW in 2024. Older figures should not be lined up against these without care. Uptime's 2020 survey reported a mean of 8.4 kW per rack, which is a different calculation, so each series is best read as its own trend line.
Why Enterprise Racks Climb Slowly While AI Racks Leap Ahead
Enterprise density rises slowly because the hardware changes slowly. Servers draw a little more with each refresh, virtualization packs more load into each box, and racks drift upward a few kilowatts at a time. Uptime's 2025 report found that more than 80% of operators have no racks above 30 kW, and only about one in eight facilities has racks in the 30 to 59 kW range.
AI training moves on a different clock. Uptime's chief technology officer said that AI training sites are pushing densities up faster than anywhere else, while enterprise workloads still grow by roughly 25% to 30% a year on their own. Operators are designing for two markets at once, a split that mirrors the gap between enterprise data centres and hyperscale facilities.
Inference Vs Training: Why AI Racks Do Not Draw the Same Power
AI data centre power consumption is concentrated in a small number of very dense sites. Uptime's 2025 data suggests that HPC and AI training are concentrated in relatively few facilities, and cabinets above 100 kW remain rare across the wider sample.
Above 60 kW per rack, HPC and AI become the main driver of density. Between 10 and 30 kW, enterprise software such as databases and ERP is still the most common one.
Inference sits lower on that scale. Serving a trained model needs far less hardware than building one, so inference deployments can often fit in the 10 to 30 kW band. That band is within reach of many facilities built for dense enterprise loads, which matters for companies weighing AI data centres in Canada against a hyperscale campus.
What Current GPU Roadmaps Mean for kW Per Rack
Rack-scale AI systems have reset what a single rack can draw. NVIDIA's GB200 NVL72 is listed at about 120 kW per rack and requires direct-to-chip liquid cooling, while Gigabyte lists its Vera Rubin NVL72 rack at up to 240 kW.
Against the 11 kW survey average, that is roughly 11 times higher for GB200 and more than 20 times higher for Vera Rubin. These are vendor figures for fully populated racks, but they explain why a facility's published density rating decides which hardware it can host at all.
Rack Density Tiers: What Each kW Per Rack Range Demands
A rack's power draw sets the cooling method, the circuit design, and the kind of facility that can host it. The tiers below follow the ranges Uptime uses in its surveys, with the break points where each approach changes. Treat them as planning bands rather than hard limits.
1. Under 10 kW Per Rack: Where Most Enterprise Racks Still Sit
Standard air cooling handles this range comfortably, using raised floors or containment to deliver cold air to the front of each rack. Uptime's 2020 survey found the most common density was 5 to 9 kW per rack, and most standard colocation cabinets are still priced and engineered around this band. Cooling in these facilities is usually sized for it too, which becomes the limit when a refresh pushes past it.
2. 10 To 20 kW Per Rack: The Air Cooling Ceiling
Much of the enterprise growth is happening here, with Uptime's 2025 report pointing to strong adoption of racks between 10 kW and 30 kW. Air cooling still works, but only with aisle containment, blanking panels, and matched cooling capacity. Uptime has placed the economic turning point at 20 to 25 kW per rack, so the top of this band is where to decide whether a liquid-ready path is needed.
3. 20 To 40 kW Per Rack: Where Liquid Cooling Starts to Pay Off
Above 20 kW, heat per rack outruns what room-level air handling removes economically, so operators add rear-door heat exchangers, in-row cooling, or direct-to-chip liquid. Racks in the 30 to 59 kW range are still a minority, with about one in eight facilities reporting some. Two facilities can both advertise high density while only one has cooling and distribution designed for these racks, so this is the band where facility specifics matter most.
4. 40 kW and Above: Liquid-Only Racks for AI Training
At this level the rack and the facility have to be designed together. GB200-class systems require direct-to-chip liquid cooling through in-rack or in-row coolant distribution units, and the Vera Rubin NVL72 configuration Gigabyte lists pairs four 110 kW power shelves per rack with an in-row liquid-to-liquid CDU. Very few sites are built this way today, and purpose-built training facilities, not general enterprise space, usually host the load.
|
Rack Density
|
Typical Workloads
|
Cooling Approach
|
|
Under 10 kW
|
Core enterprise applications, databases, virtualization
|
Standard air cooling
|
|
10 to 19 kW
|
Dense enterprise software, some HPC and AI
|
Air cooling with containment
|
|
20 to 29 kW
|
Consolidated enterprise, HPC, some AI
|
Precision air, or the start of liquid cooling
|
|
30 to 59 kW
|
HPC and early AI clusters, with enterprise still the larger driver
|
Rear-door, in-row, or direct liquid cooling
|
|
60 to 119 kW
|
HPC and AI training
|
Direct liquid cooling
|
|
120 kW and above
|
Rack-scale AI such as GB200 NVL72 and Vera Rubin NVL72
|
Liquid only, with CDUs and facility water loops
|
Data Centre Power Distribution Limits That Cap kW Per Rack
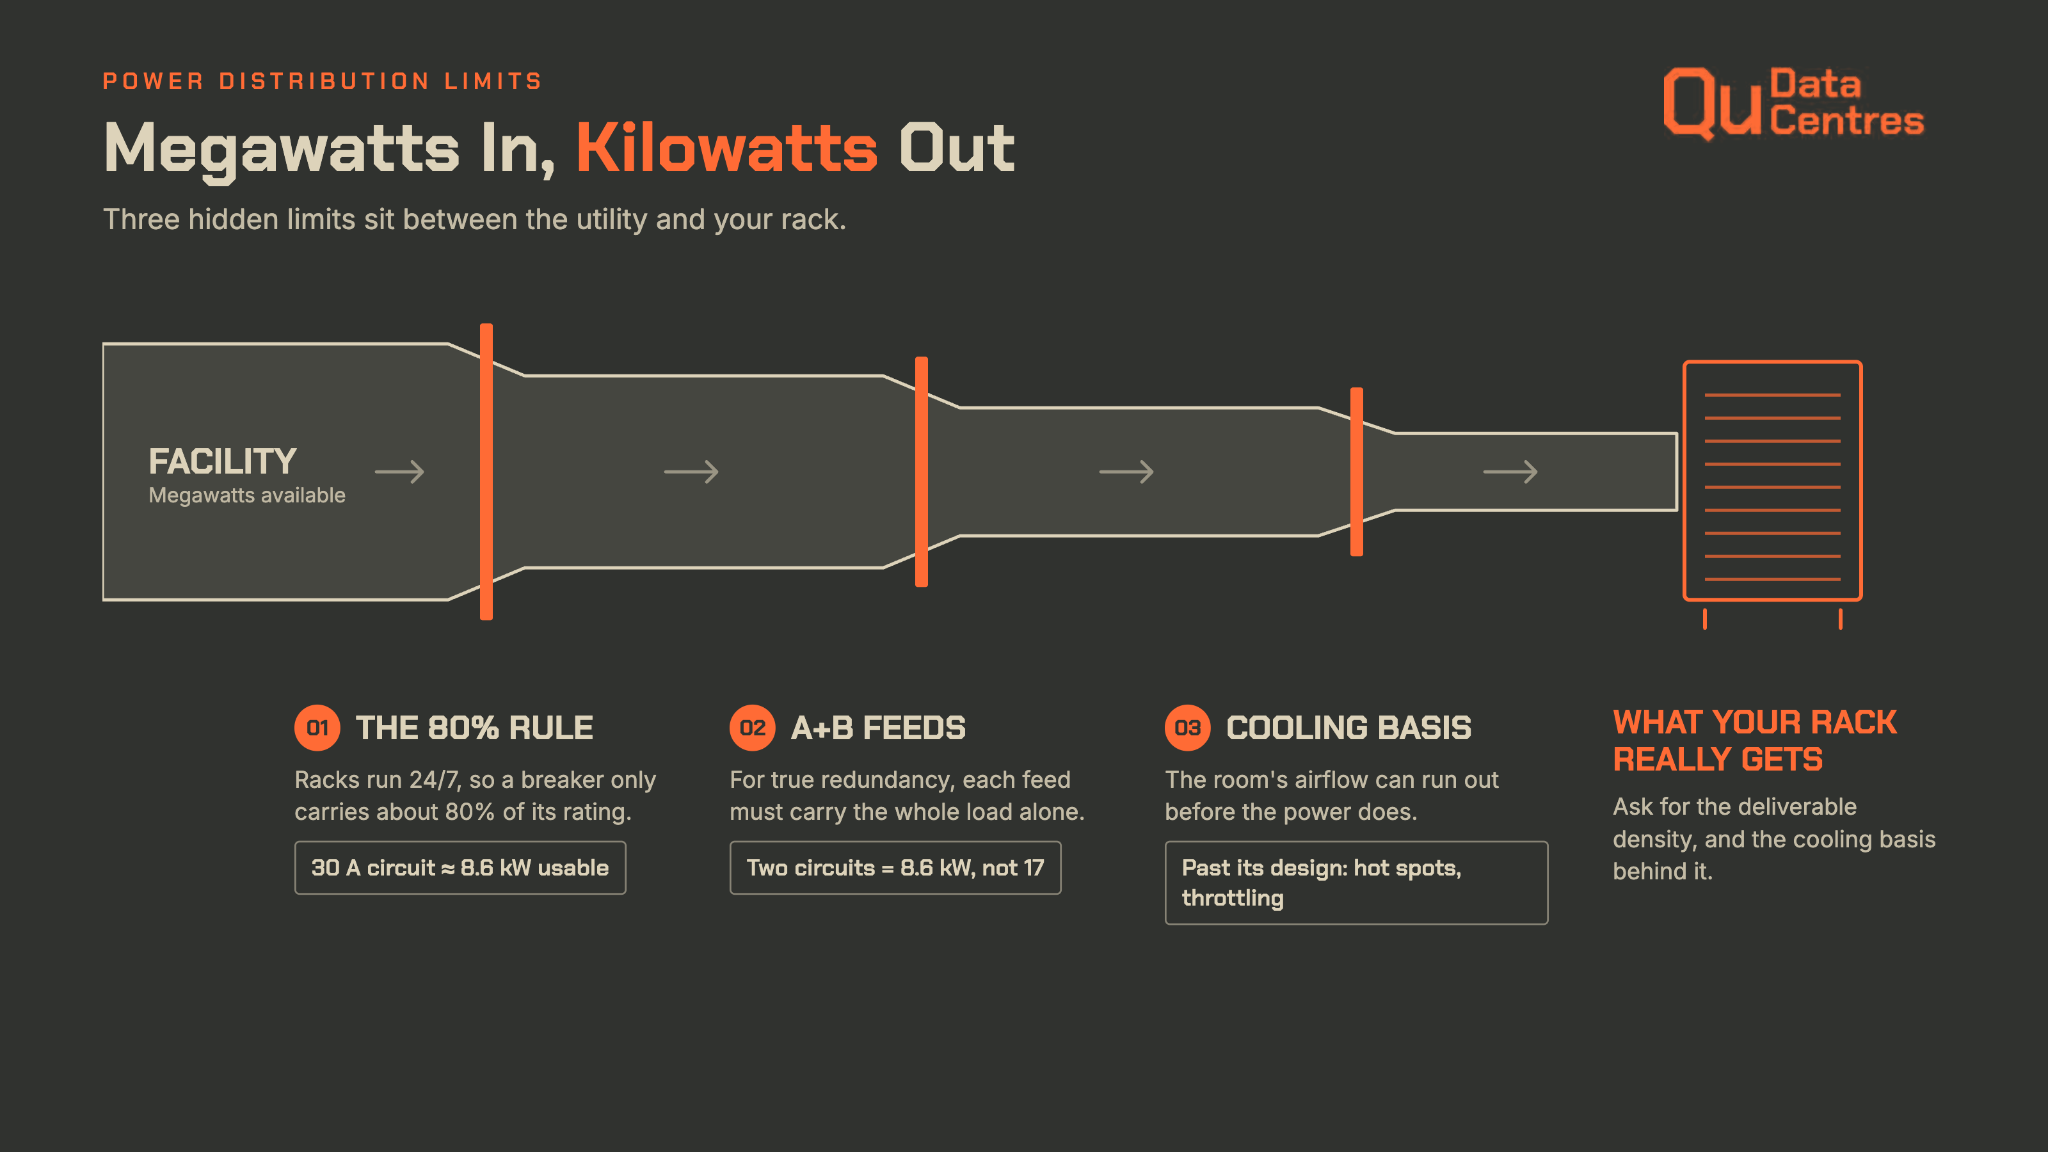
A facility can have megawatts of capacity and still limit what a single rack can draw. The limit sits in the feeds, breakers, and redundancy design between the utility and the cabinet. Three constraints do most of the capping, and none of them appears on a headline density figure.
Circuit Derating and the 80% Rule
North American electrical codes treat a load that runs for three hours or more as continuous and size the breaker for 125% of it, which means a breaker can carry about 80% of its rating on a sustained basis, and racks run around the clock.
A 208 V, 30 A three-phase circuit has a nameplate capacity of about 10.8 kVA, or roughly 8.6 kW at 80%. Step up to a 60 A three-phase circuit and the working figure is about 17 kW, which is why dense racks need larger circuits, not just more of them. These are illustrative figures that assume a power factor close to 1.
Redundant Power in a Data Centre: A+b Feeds and Usable Capacity
Redundant power in a data centre usually means two independent feeds, labelled A and B, delivered to every rack. If the rack must keep running after losing one feed, each feed has to carry the entire load. As a result, two of the 8.6 kW circuits above protect an 8.6 kW rack, not a 17 kW one.
Facility-level redundancy follows the same logic. In Uptime's 2025 survey, 2N and N+1 were the most common power redundancy levels, chosen by 42% and 41% of operators, and power caused 45% of impactful outages. Data centre backup power covers short interruptions and equipment faults, while a plan for prolonged data centre power outages belongs in backup and disaster recovery architecture.
Airflow and Cooling Capacity Per Rack
Cooling is the second limit, and the room sets it rather than the rack. A hall engineered for 5 to 10 kW per rack can run out of cooling capacity long before it runs out of electrical capacity. Pushing 15 kW into a cabinet whose airflow was designed for 6 kW creates hot spots, and the hardware throttles or shuts down to protect itself. A deliverable density figure should always name the cooling basis behind it, whether per rack, per row, or per hall.
How to Plan kW Per Rack for Your Next Hardware Refresh
Planning density is easier when it starts from the workload instead of the rack count. Here’s how you can turn survey averages into a number you can put in a contract.
Forecast Density by Workload, Not by Rack Count
Start with measured draw from existing racks, then add nameplate power for the hardware you plan to buy. Uptime notes that many mainstream servers approach or exceed 1 kW when configured for demanding workloads, so a refresh can raise rack draw even if the rack count stays flat.
GPU plans need the same discipline with larger numbers. Data centre power requirements for a cluster depend on how many servers fill each rack and whether the system is air-cooled or rack-scale liquid, which is why density belongs at the start of migrating GPU clusters from cloud to colocation rather than at cutover.
Questions to Ask a Colocation Provider About Density
Written answers to a short list of questions will expose most density risks before a contract is signed. They sit alongside the wider criteria for choosing a data centre in Canada, and they slot directly into an RFP for AI-ready colocation services so every bidder is compared on the same terms.
- Deliverable kW: What can each cabinet draw with both feeds live and redundancy intact?
- Cooling Basis: Is cooling sized per rack, per row, or per hall?
- Billing Model: Is power billed on committed kW, metered use, or a mix?
- Upgrade Path: Can kW per cabinet increase without a move, and how long does it take?
- Backup Power: What generator run time, onsite fuel, and refuelling terms apply in a long outage?
- Liquid Readiness: Is there a path to rear-door or direct liquid cooling if the workload grows?
Canadian Climate and Grid Factors for High-Density Deployments
Climate and grid capacity both shape density economics. Uptime notes that many new facilities at high latitudes in North America and Europe reach PUEs of 1.3 or better, against a global weighted average of 1.54 in 2025, and Canada's cold winters give operators more hours of efficient heat rejection.
Grid supply is the tighter constraint. How much power data centres will use across Canada is hard to forecast, and the Canada Energy Regulator treats data centre load growth as a key assumption separating its scenarios, with about 100 TWh of added demand in its Higher case.
That pushes data centre power demand into utility planning and puts a premium on capacity that is already energized.
How Qu Data Centres Matches Rack Density to Real Workloads
Density planning fails when the number on the contract and the number at the cabinet are different. Qu Data Centres is a Canadian-owned, pure-play operator with nine carrier-neutral facilities across five markets, and it publishes deliverable density for each one, from 5 to 10 kW designs up to 30 kW at TOR3. Four sites hold Uptime Institute Tier III certification, and 17 MW of powered capacity is available now, so a right-sized option does not wait on a multi-year build.
Every facility sits on Canadian soil under Canadian operations, which keeps density planning and data sovereignty in the same conversation. Whether your next refresh lands at a few kilowatts or a few dozen per rack, the colocation and managed solutions are built to fit it.
Walk the power and cooling yourself before you commit. Book a facility tour and bring your rack plan.
Frequently Asked Questions About Data Centre Power Density
What Is a Normal kW Per Rack in a Data Centre?
There is no single normal figure, but most enterprise racks run between roughly 5 and 15 kW. Industry surveys put the average of operators' most common densities at around 9 to 11 kW, while facilities with older hardware often sit below 5 kW. Racks above 30 kW remain a minority, concentrated in HPC and AI sites.
At What kW Per Rack Do You Need Liquid Cooling?
Liquid cooling usually becomes the more economical option somewhere between 20 and 25 kW per rack, and it becomes unavoidable at higher levels. Rear-door and in-row systems cover the 20 to 40 kW range, while rack-scale AI systems such as GB200 NVL72 require direct-to-chip liquid cooling. Facility design and climate shift the exact break point.
How Many kW Does an AI Server Rack Use?
It depends on the system. Smaller air-cooled GPU racks sit in the tens of kilowatts, while NVIDIA's GB200 NVL72 is rated at about 120 kW per rack and Vera Rubin NVL72 racks are listed at up to 240 kW. These are full-rack vendor figures, and actual draw varies with configuration and workload.
How Do You Calculate Data Centre Power Density?
Divide total IT load in kilowatts by the number of racks for an average, or measure each rack's draw directly. For circuit capacity, multiply volts by amps, multiply by 1.73 for three-phase, then apply 80% for continuous loads. A 208 V, 30 A three-phase circuit works out to about 8.6 kW.
Does Higher Rack Density Cost More in Colocation?
Per cabinet, usually yes, because you reserve more power and cooling. Per kilowatt, higher density can cost less since you use fewer cabinets and less floor space. The expensive mistake is committing to density you do not use, because reserved kilowatts are billed whether they are drawn or not.
Sources Used for This Article
- CUDO Compute: "NVIDIA GB200 NVL72" - cudocompute.com/products/nvidia-gb200-nvl72
- Uptime Institute: "Uptime Institute Global Data Center Survey 2025" - datacenter.uptimeinstitute.com/rs/711-RIA-145/images/2025.Annual.Survey.Report.pdf
- Data Center Knowledge: "AI Drives Data Center Uncertainty in Uptime's 2026 Survey" - datacenterknowledge.com/ai-data-centers/ai-drives-data-center-uncertainty-in-uptime-s-2026-survey
- GIGABYTE: "GIGAPOD POD Scale: NVIDIA Vera Rubin NVL72" - gigabyte.com/hk/Enterprise/GIGAPOD-Pod-Scale/AI-DLC-POD_NVIDIA-Vera-Rubin-NVL72
- Uptime Institute Journal: "Rack density is rising" - journal.uptimeinstitute.com/rack-density-is-rising/
- Canada Energy Regulator (CER): "Canada's Energy Future 2026: Scenario Results" - cer-rec.gc.ca/en/data-analysis/canada-energy-future/2026/results/





Quick Answer: Data centre power density is the electrical load each rack draws, measured in kilowatts (kW). Uptime Institute's 2026 survey puts the average of operators' most common rack densities at 11 kW, up from 9 kW in 2025. AI systems sit far above that, with NVIDIA's GB200 NVL72 rated at about 120 kW per rack and next-generation racks listed at up to 240 kW. Above roughly 20 to 25 kW per rack, liquid cooling usually becomes the more economical choice.
Key Takeaways
Rack density is one of the most quoted and least defined numbers in infrastructure planning. One report says the typical rack draws under 10 kW, another says AI racks pull more than 100 kW, and both are correct. If you are signing off on a hardware refresh or a GPU deployment, that gap is not academic.
Overestimate density and you pay for power and cooling that sit idle every month. Underestimate it and the new hardware arrives to find circuits, breakers, or cooling that cannot support it. Either mistake is expensive, and neither shows up until the contract is signed.
What Is Data Centre Power Density and How Is kW Per Rack Measured?
Data centre power density describes how much electrical load sits inside a given footprint, and today it is almost always quoted per rack. The figure drives decisions about circuits, cooling, and contract size. Three different numbers hide behind it, and mixing them up is the most common source of confusion.
kW Per Rack Vs Watts Per Square Foot
Facilities were once sized in watts per square foot, a floor-level figure that said little about what any one customer could install. Kilowatts per rack replaced it because the rack is the unit a customer buys, wires, and cools. A 6 kW rack and a 30 kW rack can sit on the same square foot of raised floor and place completely different demands on the building. That is why kW per rack decides what you can install in a colocation cabinet before the facility's limits are reached.
Rated, Provisioned, and Measured Power Draw
Quoted densities usually refer to one of three numbers, and they rarely match. Keeping them apart makes any survey or vendor claim easier to read.
Provisioned power decides whether hardware can be switched on, and measured draw decides what you should be paying for. The gap between the two is where most budget gets wasted, as the colocation section below shows.
How Rack Density Affects Cooling, Cost, and Floor Space
The reason data centres need so much power is simple. Almost every watt delivered to a server leaves as heat, so every kilowatt of IT load needs matching cooling capacity.
That is why data centre power and cooling are planned together, and why a density increase hits both budgets at once. Each density tier also calls for a different data centre cooling approach.
Density does buy something in return. Fewer, fuller racks cut floor space and cabling, and Uptime notes that it does not take many servers to cross 10 kW when mainstream models approach or exceed 1 kW each. The catch is that density only pays off when the power and cooling serving each rack can keep up.
Data Centre Power Density Trends: How Average kW Per Rack Has Changed
Average rack density is rising, but more slowly than headlines suggest, and the pace depends on who is counting. The latest Uptime Institute surveys give the cleanest read on the installed base, and they show why a single average hides two very different markets.
Average Vs Modal Rack Density in the 2026 Surveys
Uptime asks each operator for the most common (modal) rack density in its facility, then averages those answers across the sample. In 2026 that average reached 11 kW, up from 9 kW in 2025. Excluding facilities designed for typical densities above 30 kW, it sits at 7.8 kW, up from 7.5 kW a year earlier.
The 2025 report shows the same pattern, with the average at almost 9 kW, up from 8.3 kW in 2024. Older figures should not be lined up against these without care. Uptime's 2020 survey reported a mean of 8.4 kW per rack, which is a different calculation, so each series is best read as its own trend line.
Why Enterprise Racks Climb Slowly While AI Racks Leap Ahead
Enterprise density rises slowly because the hardware changes slowly. Servers draw a little more with each refresh, virtualization packs more load into each box, and racks drift upward a few kilowatts at a time. Uptime's 2025 report found that more than 80% of operators have no racks above 30 kW, and only about one in eight facilities has racks in the 30 to 59 kW range.
AI training moves on a different clock. Uptime's chief technology officer said that AI training sites are pushing densities up faster than anywhere else, while enterprise workloads still grow by roughly 25% to 30% a year on their own. Operators are designing for two markets at once, a split that mirrors the gap between enterprise data centres and hyperscale facilities.
Inference Vs Training: Why AI Racks Do Not Draw the Same Power
AI data centre power consumption is concentrated in a small number of very dense sites. Uptime's 2025 data suggests that HPC and AI training are concentrated in relatively few facilities, and cabinets above 100 kW remain rare across the wider sample.
Above 60 kW per rack, HPC and AI become the main driver of density. Between 10 and 30 kW, enterprise software such as databases and ERP is still the most common one.
Inference sits lower on that scale. Serving a trained model needs far less hardware than building one, so inference deployments can often fit in the 10 to 30 kW band. That band is within reach of many facilities built for dense enterprise loads, which matters for companies weighing AI data centres in Canada against a hyperscale campus.
What Current GPU Roadmaps Mean for kW Per Rack
Rack-scale AI systems have reset what a single rack can draw. NVIDIA's GB200 NVL72 is listed at about 120 kW per rack and requires direct-to-chip liquid cooling, while Gigabyte lists its Vera Rubin NVL72 rack at up to 240 kW.
Against the 11 kW survey average, that is roughly 11 times higher for GB200 and more than 20 times higher for Vera Rubin. These are vendor figures for fully populated racks, but they explain why a facility's published density rating decides which hardware it can host at all.
Rack Density Tiers: What Each kW Per Rack Range Demands
A rack's power draw sets the cooling method, the circuit design, and the kind of facility that can host it. The tiers below follow the ranges Uptime uses in its surveys, with the break points where each approach changes. Treat them as planning bands rather than hard limits.
1. Under 10 kW Per Rack: Where Most Enterprise Racks Still Sit
Standard air cooling handles this range comfortably, using raised floors or containment to deliver cold air to the front of each rack. Uptime's 2020 survey found the most common density was 5 to 9 kW per rack, and most standard colocation cabinets are still priced and engineered around this band. Cooling in these facilities is usually sized for it too, which becomes the limit when a refresh pushes past it.
2. 10 To 20 kW Per Rack: The Air Cooling Ceiling
Much of the enterprise growth is happening here, with Uptime's 2025 report pointing to strong adoption of racks between 10 kW and 30 kW. Air cooling still works, but only with aisle containment, blanking panels, and matched cooling capacity. Uptime has placed the economic turning point at 20 to 25 kW per rack, so the top of this band is where to decide whether a liquid-ready path is needed.
3. 20 To 40 kW Per Rack: Where Liquid Cooling Starts to Pay Off
Above 20 kW, heat per rack outruns what room-level air handling removes economically, so operators add rear-door heat exchangers, in-row cooling, or direct-to-chip liquid. Racks in the 30 to 59 kW range are still a minority, with about one in eight facilities reporting some. Two facilities can both advertise high density while only one has cooling and distribution designed for these racks, so this is the band where facility specifics matter most.
4. 40 kW and Above: Liquid-Only Racks for AI Training
At this level the rack and the facility have to be designed together. GB200-class systems require direct-to-chip liquid cooling through in-rack or in-row coolant distribution units, and the Vera Rubin NVL72 configuration Gigabyte lists pairs four 110 kW power shelves per rack with an in-row liquid-to-liquid CDU. Very few sites are built this way today, and purpose-built training facilities, not general enterprise space, usually host the load.
Rack Density
Typical Workloads
Cooling Approach
Under 10 kW
Core enterprise applications, databases, virtualization
Standard air cooling
10 to 19 kW
Dense enterprise software, some HPC and AI
Air cooling with containment
20 to 29 kW
Consolidated enterprise, HPC, some AI
Precision air, or the start of liquid cooling
30 to 59 kW
HPC and early AI clusters, with enterprise still the larger driver
Rear-door, in-row, or direct liquid cooling
60 to 119 kW
HPC and AI training
Direct liquid cooling
120 kW and above
Rack-scale AI such as GB200 NVL72 and Vera Rubin NVL72
Liquid only, with CDUs and facility water loops
Data Centre Power Distribution Limits That Cap kW Per Rack
A facility can have megawatts of capacity and still limit what a single rack can draw. The limit sits in the feeds, breakers, and redundancy design between the utility and the cabinet. Three constraints do most of the capping, and none of them appears on a headline density figure.
Circuit Derating and the 80% Rule
North American electrical codes treat a load that runs for three hours or more as continuous and size the breaker for 125% of it, which means a breaker can carry about 80% of its rating on a sustained basis, and racks run around the clock.
A 208 V, 30 A three-phase circuit has a nameplate capacity of about 10.8 kVA, or roughly 8.6 kW at 80%. Step up to a 60 A three-phase circuit and the working figure is about 17 kW, which is why dense racks need larger circuits, not just more of them. These are illustrative figures that assume a power factor close to 1.
Redundant Power in a Data Centre: A+b Feeds and Usable Capacity
Redundant power in a data centre usually means two independent feeds, labelled A and B, delivered to every rack. If the rack must keep running after losing one feed, each feed has to carry the entire load. As a result, two of the 8.6 kW circuits above protect an 8.6 kW rack, not a 17 kW one.
Facility-level redundancy follows the same logic. In Uptime's 2025 survey, 2N and N+1 were the most common power redundancy levels, chosen by 42% and 41% of operators, and power caused 45% of impactful outages. Data centre backup power covers short interruptions and equipment faults, while a plan for prolonged data centre power outages belongs in backup and disaster recovery architecture.
Airflow and Cooling Capacity Per Rack
Cooling is the second limit, and the room sets it rather than the rack. A hall engineered for 5 to 10 kW per rack can run out of cooling capacity long before it runs out of electrical capacity. Pushing 15 kW into a cabinet whose airflow was designed for 6 kW creates hot spots, and the hardware throttles or shuts down to protect itself. A deliverable density figure should always name the cooling basis behind it, whether per rack, per row, or per hall.
How to Plan kW Per Rack for Your Next Hardware Refresh
Planning density is easier when it starts from the workload instead of the rack count. Here’s how you can turn survey averages into a number you can put in a contract.
Forecast Density by Workload, Not by Rack Count
Start with measured draw from existing racks, then add nameplate power for the hardware you plan to buy. Uptime notes that many mainstream servers approach or exceed 1 kW when configured for demanding workloads, so a refresh can raise rack draw even if the rack count stays flat.
GPU plans need the same discipline with larger numbers. Data centre power requirements for a cluster depend on how many servers fill each rack and whether the system is air-cooled or rack-scale liquid, which is why density belongs at the start of migrating GPU clusters from cloud to colocation rather than at cutover.
Questions to Ask a Colocation Provider About Density
Written answers to a short list of questions will expose most density risks before a contract is signed. They sit alongside the wider criteria for choosing a data centre in Canada, and they slot directly into an RFP for AI-ready colocation services so every bidder is compared on the same terms.
Canadian Climate and Grid Factors for High-Density Deployments
Climate and grid capacity both shape density economics. Uptime notes that many new facilities at high latitudes in North America and Europe reach PUEs of 1.3 or better, against a global weighted average of 1.54 in 2025, and Canada's cold winters give operators more hours of efficient heat rejection.
Grid supply is the tighter constraint. How much power data centres will use across Canada is hard to forecast, and the Canada Energy Regulator treats data centre load growth as a key assumption separating its scenarios, with about 100 TWh of added demand in its Higher case.
That pushes data centre power demand into utility planning and puts a premium on capacity that is already energized.
How Qu Data Centres Matches Rack Density to Real Workloads
Density planning fails when the number on the contract and the number at the cabinet are different. Qu Data Centres is a Canadian-owned, pure-play operator with nine carrier-neutral facilities across five markets, and it publishes deliverable density for each one, from 5 to 10 kW designs up to 30 kW at TOR3. Four sites hold Uptime Institute Tier III certification, and 17 MW of powered capacity is available now, so a right-sized option does not wait on a multi-year build.
Every facility sits on Canadian soil under Canadian operations, which keeps density planning and data sovereignty in the same conversation. Whether your next refresh lands at a few kilowatts or a few dozen per rack, the colocation and managed solutions are built to fit it.
Walk the power and cooling yourself before you commit. Book a facility tour and bring your rack plan.
Frequently Asked Questions About Data Centre Power Density
What Is a Normal kW Per Rack in a Data Centre?
There is no single normal figure, but most enterprise racks run between roughly 5 and 15 kW. Industry surveys put the average of operators' most common densities at around 9 to 11 kW, while facilities with older hardware often sit below 5 kW. Racks above 30 kW remain a minority, concentrated in HPC and AI sites.
At What kW Per Rack Do You Need Liquid Cooling?
Liquid cooling usually becomes the more economical option somewhere between 20 and 25 kW per rack, and it becomes unavoidable at higher levels. Rear-door and in-row systems cover the 20 to 40 kW range, while rack-scale AI systems such as GB200 NVL72 require direct-to-chip liquid cooling. Facility design and climate shift the exact break point.
How Many kW Does an AI Server Rack Use?
It depends on the system. Smaller air-cooled GPU racks sit in the tens of kilowatts, while NVIDIA's GB200 NVL72 is rated at about 120 kW per rack and Vera Rubin NVL72 racks are listed at up to 240 kW. These are full-rack vendor figures, and actual draw varies with configuration and workload.
How Do You Calculate Data Centre Power Density?
Divide total IT load in kilowatts by the number of racks for an average, or measure each rack's draw directly. For circuit capacity, multiply volts by amps, multiply by 1.73 for three-phase, then apply 80% for continuous loads. A 208 V, 30 A three-phase circuit works out to about 8.6 kW.
Does Higher Rack Density Cost More in Colocation?
Per cabinet, usually yes, because you reserve more power and cooling. Per kilowatt, higher density can cost less since you use fewer cabinets and less floor space. The expensive mistake is committing to density you do not use, because reserved kilowatts are billed whether they are drawn or not.
Sources Used for This Article
Paul M
Paul Miedzik is Senior Manager of Marketing at Qu Data Centres, with extensive experience in enterprise cloud and digital infrastructure across the Canadian tech sector.